

Chapter 4
Undergraduate Student Success
Goals
The University of Michigan prepares its students to become leaders in the 21st century. U-M’s academic and extra-curricular programs have been developed and implemented so that each student can complete a meaningful degree program in a reasonable time, and thereby advance his or her career and personal goals. Comprehensive academic and support services are designed to help students complete their degrees efficiently while developing both professionally and personally. Students have access to research opportunities, internships, and career development resources through their respective schools and colleges. U-M also fosters a sense of community belonging while helping students develop global perspectives that shape their contributions to society during their academic careers and after graduation.
Overview
Each undergraduate school or college at the University of Michigan has developed initiatives to help students address impediments to successful degree completion. To support student success, academic units track performance in key courses and offer additional academic advising to students who may benefit from it. Additionally, all students may utilize academic support services and programs, including departmental tutoring, study skills workshops, mentoring, and programs offered by the Sweetland Writing Center and Science Learning Center.
In 2023, the provost announced the appointment of the inaugural Vice Provost for Undergraduate Education. The position is responsible for leading, overseeing and advancing continual improvements in education, for more than 32,000 undergraduate students in partnership with schools and colleges that enroll undergraduate students. The position is responsible for coordination among those at the forefront of undergraduate education, including faculty, advisors, data analysts, administrators, professional staff members – and students themselves – in order to promote academic success.
Ninety-seven percent of first-year undergraduates enroll the following fall. More than three-quarters of Michigan undergraduate students complete their first degree within four years. Approximately 93 percent of recent undergraduates earn a degree within six years of initial enrollment. The University of Michigan’s six-year completion rates are now 10 percentage points higher than the average of public Association of American Universities (AAU) member institutions, and equal to the average of AAU private universities. These high rates reflect the institution’s ability to recruit excellent, well-prepared students and deliver high-quality education in a supportive environment.
The University’s undergraduates are surveyed regularly and report positive opinions of the institution as a whole and of their individual academic programs. In addition to graduate school or employment, University of Michigan students are increasingly interested in becoming entrepreneurs, with a growing number of students launching business ventures.
Graduation Rates – All Undergraduates
U-M graduation rates are higher than the average rates for AAU public universities and comparable to the average 6-year rates for AAU private universities.
,Graduated within 4 years,Graduated within 5 years,Graduated within 6 years
2008,76,13,2
2009,75,13,2
2010,76,13,2
2011,77,12,3
2012,79,11,2
2013,80,12,1
2014,81,11,1
2015,81,11,2
2016,81,11,1
2017,82,10,1
,Graduated within 4 years,Graduated within 5 years,Graduated within 6 years
2008,57,18,4
2009,58,19,3
2010,59,18,3
2011,60,18,3
2012,61,17,3
2013,61,17,3
2014,63,16,3
2015,65,15,2
2016,66,14,2
2017,66,13,2
,Graduated within 4 years,Graduated within 5 years,Graduated within 6 years
2008,82,8,2
2009,82,8,2
2010,83,7,2
2011,82,7,2
2012,83,8,2
2013,83,7,2
2014,84,8,2
2015,84,7,2
2016,84,7,2
2017,80,11,1
SOURCE: Integrated Postsecondary Education Data System (IPEDS)
This chart shows the percentages of first-year undergraduate cohorts that have graduated with a bachelor’s degree in four, five and six years. The bottom axis represents the year each first-year cohort started college.
Graduation Rates – Pell Grant Recipients
U-M Graduation rates for Pell Grant recipients have increased over time. The gap between the graduation rates of these students and the rest of their undergraduate peers is lower than the average public universities gap.
Year,Pell Grant recipient graduation rate,Graduation rate gap compared to all undergraduates
2010,85,6
2011,87,5
2012,85,7
2013,88,5
2014,89,4
2015,89,5
2016,86,7
2017,89,4
2018,89,4
Year,Pell Grant recipient graduation rate,Graduation rate gap compared to all undergraduates
2010,73,6
2011,73,6
2012,74,6
2013,73,7
2014,74,7
2015,75,6
2016,75,6
2017,75,6
2018,75,7
Year,Pell Grant recipient graduation rate,Graduation rate gap compared to all undergraduates
2010,89,2
2011,89,2
2012,89,3
2013,89,3
2014,90,2
2015,89,3
2016,90,3
2017,90,2
2018,90,2
SOURCE: Integrated Postsecondary Education Data System (IPEDS)
Pell Grant recipients must demonstrate financial need through submission of the Free Application for Federal Student Aid. Public institutions tend to have a larger percentage of their undergraduate student body made up of students who are eligible for the Pell Grant.
Average Time to Degree
The average time to degree for U-M full-time first-year undergraduate students is decreasing over time, resulting in lower total costs of attending.
,2015,2025
First-years,3.89,3.8
Transfers,2.56,2.56
SOURCE: U-M Student Data Sets
The expected timeframe for undergraduate students to complete their degree is typically four years. University of Michigan students tend to earn their degrees in less time than expected. Transfer students typically enter the university with one or two years of study already completed.
Retention Rates
A high percentage of U-M’s first-year undergraduates enroll in courses the following year, and at rates similar to peer institutions.
,Average,Average,Average
Chicago,99.0,,
MIT,98.7,,
Penn,97.4,,
Northwestern,97.2,,
Duke,97.1,,
UCLA,97.0,,
Georgia Tech,97.0,,
Stanford,97.0,,
MICHIGAN,,96.9,
AAU PRIVATES,,,96.8
Virginia,96.8,,
Columbia,96.8,,
Cornell,96.7,,
Carnegie Mellon,96.6,,
UNC-Chapel Hill,96.5,,
Washington-St. Louis,96.5,,
UC-Berkeley,96.5,,
Johns Hopkins,96.5,,
Princeton,96.4,,
USC,96.1,,
Harvard,95.8,,
Texas-Austin,95.5,,
Yale,95.5,,
AAU PUBLICS,,,95.5
Wisconsin,94.9,,
Emory,94.7,,
Ohio State,94.3,,
Washington,94.3,,
Illinois,93.3,,
SOURCE: Integrated Postsecondary Education Data System (IPEDS)
First-years at the U-M and its peers return to enroll for a second year at high rates. Average retention rates for public and private member schools of the Association of American Universities (AAU) are shown for comparison. A list of Association of American Universities (AAU) member institutions and U-M benchmarking peer institutions is published in Appendix A.
Median Earnings After Graduating
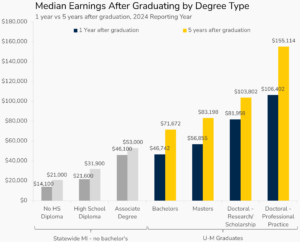
Research consistently demonstrates higher earnings for bachelor’s degree recipients. U-M graduates earn more than MI residents without a bachelor’s degree 5 years after graduation.
4.5 Median Earnings after Graduating, by Degree Type, 1 year vs 5 years after graduation, 2024 Reporting Year
SOURCE: MI School Data (www.mischooldata.org); Post-Secondary Employment Outcomes Explorer – Census Bureau
U-M bachelor’s degree recipients earn more, on average, than Michigan residents without a bachelor’s degree. Even just one year out of college, graduates earn significantly more, and the earnings increases are even greater five years out of college.
Return on Investment
Over their lifetime, U-M undergraduate alumni earn significantly more than the average for graduates from US public or private institutions.
,ROI,ROI,ROI
MICHIGAN,2807000,,
US Public grad,,1794000,
US Private nonprofit grad,,,1744000
SOURCE: Georgetown University Center on Education and the Workforce analysis of data from the US Department of Education, College Scorecard, 2009-22
A 2025 Georgetown University Center on Education and the Workforce study shows how obtaining a four-year degree continues to boost lifetime earnings, with U-M graduates earning a higher ROI than the average of graduates from public and private universities.
Top Industries of U-M Bachelor’s Degree Recipients
The top three industries that U-M bachelor’s degree earners enter are Information Technology, Education, and Healthcare.
4.7 Top Industries of U-M Bachelor’s Degree Recipients
| Industry | Alumni count |
|---|---|
| Information Technology | 15,412 |
| Education | 12,619 |
| Healthcare | 12,065 |
| Finance | 10,526 |
| Automotive | 3,950 |
| Consulting | 3,796 |
| Legal | 3,647 |
| Government | 3,443 |
| Arts & Entertainment | 3,172 |
| Life Sciences | 3,048 |
SOURCE: Steppingblocks, Inc. 2025 analysis of U-M alumni data
The table above shows results from a 2025 analysis of U-M bachelor’s degree recipients currently working in the US. The top five Fortune 500 employers for U-M alum are Amazon, Ford Motor Company, General Motors, Dow, and DTE.
Alumni Map
A recent analysis by Steppingblocks, Inc., a national consulting firm, found that over 43,000 alumni who graduated from UMAA with bachelor’s degrees between 2000 and 2025 currently work in Michigan.
State,"Number of Current, Living U of M Alumni"
us-al,133
us-ak,52
us-az,769
us-ar,70
us-ca,13230
us-co,2538
us-ct,513
us-de,61
us-dc,3472
us-fl,2372
us-ga,1477
us-hi,115
us-id,75
us-il,11327
us-in,685
us-ia,122
us-ks,142
us-ky,212
us-la,171
us-me,93
us-md,878
us-ma,2836
us-mi,43240
us-mn,909
us-ms,50
us-mo,472
us-mt,75
us-ne,79
us-nv,268
us-nh,78
us-nj,957
us-nm,122
us-ny,17459
us-nc,1422
us-nd,30
us-oh,1914
us-ok,87
us-or,778
us-pa,1934
us-ri,104
us-sc,265
us-sd,14
us-tn,681
us-tx,3229
us-ut,364
us-vt,87
us-va,1176
us-wa,3344
us-wv,109
us-wi,964
us-wy,34
SOURCE: Steppingblocks, Inc. 2025 analysis of U-M alumni data
The map above shows results from a 2025 analysis of individuals who received a U-M bachelor’s degree between the years 2000-2025 and are currently working in the US. The three other states that U-M undergraduate alum most commonly live and work in post-graduation are New York, California, and Illinois.
Satisfaction with Academic Experience
Seniors have expressed a high level of satisfaction with their U-M academic experience over several measures and satisfaction has generally increased over time.
4.9 Responses of U-M Graduating Seniors to Survey Questions about Satisfaction with Academics and Course Availability, 2009-2024
,Very Dissatisfied,Dissatisfied,Somewhat Dissatisfied,Somewhat Satisfied,Satisfied,Very Satisfied
2024,1,1,3,14,54,27
2022,1,0,6,15,47,31
2019,2,4,9,27,42,16
2017,1,3,7,25,45,19
2015,1,3,6,24,44,22
,Very Dissatisfied,Dissatisfied,Somewhat Dissatisfied,Somewhat Satisfied,Satisfied,Very Satisfied
2024,1,1,3,10,45,40
2022,0,0,2,11,41,46
2019,2,3,4,14,45,32
2017,1,1,4,11,44,39
2015,1,1,2,9,46,41
,Very Dissatisfied,Dissatisfied,Somewhat Dissatisfied,Somewhat Satisfied,Satisfied,Very Satisfied
2024,2,3,9,21,44,21
2022,1,2,5,24,41,27
2019,2,4,10,22,45,17
2017,2,4,10,23,44,17
2015,1,3,8,21,48,19
,Very Dissatisfied,Dissatisfied,Somewhat Dissatisfied,Somewhat Satisfied,Satisfied,Very Satisfied
2024,1,2,8,25,46,18
2022,1,1,7,23,43,25
2019,2,4,8,25,45,16
2017,1,5,8,27,43,16
2015,1,4,8,29,42,16
SOURCE: U-M Asks You (UMAY) undergraduate survey
The percentage to the right of each bar is the fraction of students who replied “Very Satisfied”, “Satisfied” and “Somewhat Satisfied” (the segments shaded in blue) for the particular question and year.
Previous Chapter
Undergraduate Affordability
Keeping a World-Class Education Within Reach
Next Chapter
Graduate Students
Rigorous & Remarkable Programs