

Chapter 3
Undergraduate Affordability
Goals
One of the University of Michigan’s goals is to enable all qualified undergraduate resident students to attend regardless of socioeconomic background. For many years, the U-M has provided financial aid packages that meet the full cost of tuition for admitted in-state students with demonstrated need. In 2017 the university enhanced this commitment with the Go Blue Guarantee, a pledge to provide the full cost of tuition to admitted in-state students based on family income and assets. For Fall 2025, Michigan families with incomes $125,000 and under & assets below $125,000 qualify. The university’s substantial investments in student aid are also supplemented by federal and state grants, scholarships, and loans.
Overview
The university strives to minimize tuition increases while responding to student support needs including mental health services, career services, campus security, and curricular development. It has been able to reduce the net price for undergraduate students with financial need despite dramatic declines in state support, making sizable and growing investments in financial aid which are funded through a combination of aggressive cost containment and generous philanthropic contributions. Among Michigan public 4-year higher education institutions, U-M has the lowest or near lowest net price for family incomes less than $100K.
Over the last decade, the university has increased its aid investments at a pace higher than tuition increases. In 2023-24, U-M disbursed financial aid to 71 percent of in-state and 51 percent of out-of-state students. The average student loan debt for in-state students in the class of 2024 was $21,882. Aid packages combine need and merit-based grants and scholarships, loans, and work study employment. In acknowledgment of the real concern over the nation’s rising student loan debt, the university has worked hard to provide students with more and larger grants, which do not need to be repaid, and to reduce their reliance on loans.
Undergraduate Tuition and Fees
Tuition and fee increases for in-state, first-year undergraduates have not exceeded the inflation rate for the past seven years.
,In-State,Out-of-State,US ECI
2016,2.7,3.7,2.1
2017,3.9,4.4,2.3
2018,2.9,4.5,2.6
2019,2.9,3.9,2.8
2020,1.9,3.7,2.7
2021,2.5,2.1,2.7
2022,1.4,1.8,4.3
2023,3.4,3.9,4.9
2024,2.9,4.9,4.2
2025,2.9,4.9,3.7
2026,3.4,4.9,3.4
SOURCE: U-M Student Data Sets
The average annual growth rate of tuition and fees during the last decade is 2.8% for in-state and 3.9% for out-of-state first-year undergraduates. The tuition rate in this chart is the “lower division” rate, which is charged to most first-year students.
Due to declining state appropriations, tuition and fees make up an increasing portion of the general fund budget that is required to cover the costs of instruction, financial aid, academic advising, libraries, computing centers, and related student support services. See Chapter 10 -Budgets & Fundraising for more information.
Cost of Attendance
Attending UM-Ann Arbor is becoming more affordable for in-state students. Adjusted for inflation, the Cost of Attendance for in-state first-year undergraduate students is decreasing annually.
,"U-M, In-state","AAU Publics, In-state","U-M, out-of-state","AAU Publics, Out-of-state",AAU Privates
2015,35741,35933,73384,62636,85414
2016,36090,35785,74527,61664,84702
2017,36506,35799,75843,62486,85670
2018,36492,35586,76845,62669,86421
2019,36411,35290,77377,62550,87107
2020,36331,35098,78028,62380,87920
2021,35886,34665,77281,61684,87462
2022,35268,33782,75761,60030,86899
2023,34966,33349,75186,58759,86156
2024,34782,33781,75626,58927,86831
SOURCE: Integrated Postsecondary Education Data System (IPEDS); Based on 2024 U.S. Employment Cost Index
The changes in Cost of Attendance for in-state U-M first-year undergraduate students are comparable to in-state first-years at AAU public universities. Costs for Out-of-State students fall between AAU Privates and AAU Publics and are increasing year-over-year.
The total cost of attendance for incoming first-years is a benchmark figure that includes tuition and required fees, room and board, reasonable estimates for the costs of books and supplies, transportation, and miscellaneous expenses. The actual cost of attendance for individual students will vary depending on financial aid provided, transportation requirements and housing choices.
Net Price
The out-of-pocket cost of attending UM-Ann Arbor depends on a student’s family income. Students with less than $80k in family income have expenses fully covered by financial aid.
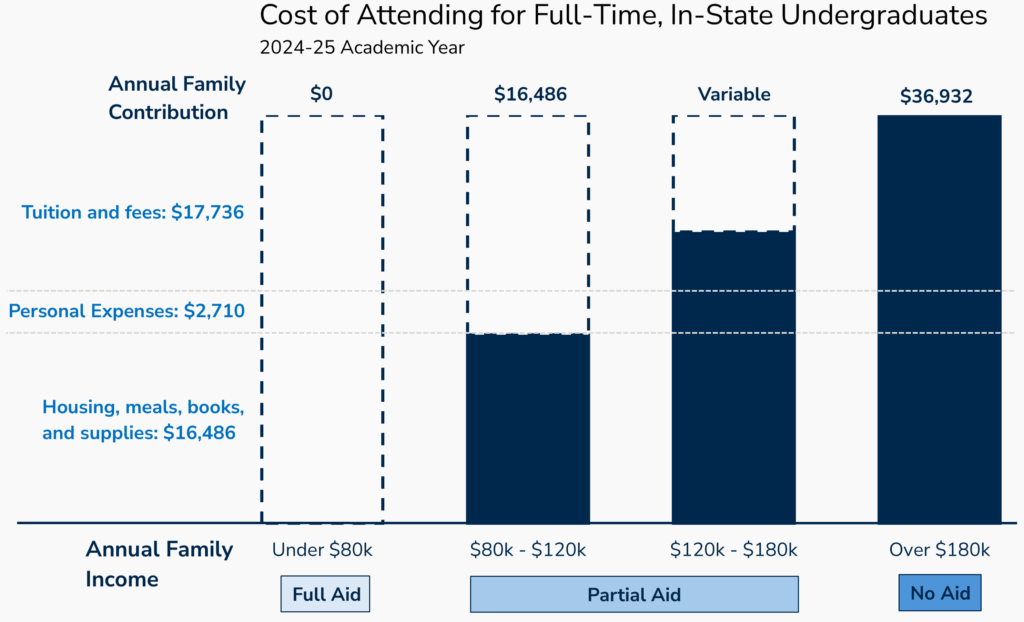
3.3.1 Cost of Attending for Full-Time, In-State Undergraduates, Academic Year 2024-25. SOURCE: U-M Sample Financial Aid Packages, Office of Financial Aid
U-M has the most comprehensive need-based program for Michigan residents, with the lowest net-price among the 15 Michigan 4-Year Publics for students whose families earn less than $80k annually. Through the Go Blue Guarantee program, in-state students with family income and assets below a certain threshold have their full tuition & fees covered. Eligibility for the Go Blue Guarantee now extends to $125k beginning Fall 2025, making the true cost of attending college more affordable. For more information visit: goblueguarantee.umich.edu.
U-M efforts to keep costs affordable have been greatly aided by the state’s new need-based Michigan Achievement Scholarship, first offered in academic year 2023-24.
,Coverage,Gap
 <$20k,93,7
$20-$40k,93,7
$40-60k,82,18
$60-80k,72,28
$80-100k,56,44
$100-120k,39,61
,Coverage,Gap
 <$20k,100,0
$20-$40k,100,0
$40-60k,91,9
$60-80k,88,12
$80-100k,73,27
$100-120k,55,45
SOURCE: U-M Sample Financial Aid Packages, Office of Financial Aid
Students from in-state families in the lowest income brackets are not required to pay anything out-of-pocket to attend the University of Michigan. To assist with any costs not covered by grants or scholarships, federal student loans are offered to students who file a Free Application for Federal Student Aid (FAFSA). In addition, work-study opportunities are offered to all students whose family income is $120,000 or less.
These charts include institutional grant aid, state aid, and federal aid. Many students also receive merit-based scholarship aid, which further reduces a student’s net costs. Since these charts represent the costs that are covered by awards based on financial need, merit-based awards are not reflected in the data presented here.
U-M has the most comprehensive need-based program for Michigan residents, with the lowest, to 3rd lowest, net price among the 15 Michigan 4-Year Publics.
3.3.3 Net Price and Cost of Attendance for First-Year Undergraduates at U-M and MI Public Universities, FY2023
Institution Name,"Average net price (income $0 - $30,000)","Average net price (income $0 - $30,000)"
Eastern,14925,
Central,12672,
Wayne State,12337,
Grand Valley,11395,
SVSU,10545,
Lake S.,9949,
Western,9557,
Northern,9098,
Oakland,9004,
UM Dbn,8160,
MSU,8119,
UM Flint,5994,
Ferris,5957,
Tech,5021,
UMAA,,4926
Institution Name,"Average net price (income $30,001 - $48,000)","Average net price (income $30,001 - $48,000)"
Eastern,14959,
MSU,13980,
Wayne State,12560,
Central,11638,
Northern,11494,
Grand Valley,11390,
SVSU,11338,
Western,10010,
Oakland,8807,
Lake S.,8477,
UM Dbn,8157,
UM Flint,8152,
Ferris,7962,
Tech,6773,
UMAA,,5389
Institution Name,"Average net price (income $48,001 - $75,000)","Average net price (income $48,001 - $75,000)"
MSU,20378,
Western,18710,
Eastern,16268,
Northern,15948,
Wayne State,14864,
Grand Valley,14507,
Central,14182,
SVSU,13963,
Lake S.,12862,
Ferris,12303,
Oakland,12229,
UM Flint,11010,
Tech,10202,
UM Dbn,9589,
UMAA,,8756
Institution Name,"Average net price (income $75,001 - $110,000)","Average net price (income $75,001 - $110,000)"
MSU,25940,
Western,23468,
Grand Valley,20860,
Northern,20616,
Eastern,20089,
Wayne State,19189,
Oakland,18508,
Lake S.,18261,
Central,17215,
Ferris,17193,
SVSU,16972,
Tech,16222,
UMAA,,16042
UM Dbn,15656,
UM Flint,15096,
Institution Name,"Average net price (income greater than $110,000)","Average net price (income greater than $110,000)"
MSU,28327,
UMAA,,26787
Western,25313,
Tech,24344,
Grand Valley,23541,
Northern,22762,
Eastern,22274,
Oakland,22034,
Wayne State,21543,
Lake S.,20766,
UM Dbn,19586,
Ferris,19308,
Central,18780,
UM Flint,18709,
SVSU,18491,
Institution Name,Cost of Attendance,Cost of Attendance
UMAA,,33556
Tech,33278,
Wayne State,31548,
MSU,30990,
Eastern,30976,
Western,29426,
Oakland,29112,
UM Dbn,28056,
Lake S.,27694,
Northern,27432,
Grand Valley,27197,
UM Flint,27006,
Central,26968,
Ferris,26676,
SVSU,25285,
SOURCE: Integrated Postsecondary Education Data System (IPEDS)
All in-state and out-of-state students may use the U-M net price calculator to help estimate eligibility for any available financial aid, and approximate your out-of-pocket expenses as a degree seeking, full-time student.
Total Aid Expenditures
In the 2023-24 academic year, U-M disbursed $360 million in grant and scholarship aid from university funds to undergraduate students, an inflation-adjusted increase of $64.4 million from the previous year.
,In-State Students,Out-of-State Students
2015,120.8,103.1
2016,126.1,119.8
2017,132.7,137.8
2018,134.8,151.5
2019,144.6,166.6
2020,146.9,183.6
2021,139.4,171.0
2022,135.3,159.7
2023,156.8,181.7
2024,165.8,193.6
SOURCE: U-M Financial Aid Data
This chart shows the amount of financial aid paid to undergraduates from institutional funds as both need-based grants and merit-based scholarships.
During the pandemic in 2021 and 2022, incremental federal funds were used in financial aid packaging, and the total financial aid awarded to undergraduates remained on a positive trajectory consistent with prior years. In 2024, institutional financial aid expenditures increased substantially, continuing the upward trend in grant and scholarship aid.
Seventy one percent of in-state undergraduate students received some kind of financial aid, and 47 percent of in-state undergraduates were provided with need-based grants.
3.4.2 Number and Percentage of Undergraduate Students Receiving Aid Payments, by Aid Type, 2023-24
| Aid Type | In-State (17,547) | Out-of-State (16,183) |
|---|---|---|
| Need-based Grant Aid | 8,195 (47%) | 5,164 (32%) |
| Merit-based Scholarship Aid | 8,902 (51%) | 5,094 (31%) |
| Work-Study | 1,394 (8%) | 1,041 (6%) |
| Loans | 4,942 (28%) | 3,849 (24%) |
| Any Type of Aid | 12,469 (71%) | 8,279 (51%) |
3.4.3 Total Financial Aid Expenditures and Average Expenditure per Student, 2023-24
| Aid Awarded | In-State | Out-of-State |
|---|---|---|
| Total Aid Expenditures from all Sources | $272,515,276 | $335,616,621 |
| Average Total Aid Expended per Student Receiving Any Type of Aid | $21,855 | $40,538 |
SOURCE: U-M Office of Financial Aid
Need-Based vs Merit-Based Expenditures
Total need-based aid expenditures have increased over time. The majority of aid comes from the university and only a small fraction comes from federal or state sources.
,Institutional,Federal,State
2015,87.4,20.4,0.4
2016,94.3,19.5,0.3
2017,94.3,19.1,0.7
2018,90.2,21.5,0.7
2019,93.1,22.6,0.7
2020,91.9,27.5,0.8
2021,87.5,24.5,0.8
2022,83.2,23.7,0.8
2023,105.1,24.0,0.6
2024,110.7,25.9,7.0
,Institutional,Federal,State
2015,69.9,7.4,0.0
2016,84.1,7.8,0.0
2017,99.2,8.9,0.0
2018,113.2,10.1,0.0
2019,128.2,11.5,0.0
2020,148.2,14.9,0.0
2021,139.2,14.0,0.0
2022,129.0,13.8,0.0
2023,151.3,16.4,0.0
2024,159.1,15.8,0.0
SOURCE: U-M Financial Aid Data
Merit-based aid expenditures have increased for in-state students but have remained relatively unchanged for out-of-state students over time. Again, the majority of aid comes from institutional sources.
,Institutional,Federal,State
2015,33.4,4.4,2.8
2016,30.0,4.8,2.7
2017,38.4,4.9,2.6
2018,44.6,4.8,4.6
2019,51.5,4.7,4.5
2020,55.0,5.0,4.9
2021,51.9,5.2,4.2
2022,52.1,4.7,4.0
2023,51.7,4.7,5.1
2024,55.2,5.2,3.2
,Institutional,Federal,State
2015,33.2,6.1,0.1
2016,31.1,4.6,0.1
2017,38.6,4.5,0.1
2018,38.3,4.6,0.1
2019,38.4,3.7,0.0
2020,35.3,3.8,0.1
2021,31.8,4.3,0.1
2022,30.7,4.0,0.0
2023,30.4,3.8,0.0
2024,34.5,4.0,0.1
SOURCE: U-M Financial Aid Data
Average Grant & Scholarship Award by Source
Adjusted for inflation, institutional aid has increased significantly in the last decade. State aid also increased due to the new Michigan Achievement Scholarship in 2023. Federal aid has remained virtually unchanged.
,U-M (Institutional),Federal,State
2014,17258,6545,968
2024,25099,6888,4315
SOURCE: Integrated Postsecondary Education Data System (IPEDS); U-M Financial Aid Data
On average, the inflation-adjusted grant and scholarship aid from the U-M to a first-time, full-time undergraduate student was 49 percent higher in academic year 2024 than in 2014. The average grant and scholarship aid from the State of Michigan is more than three times larger now compared to a decade ago, and federal grant and scholarship aid, adjusted for inflation, was virtually unchanged.
The University of Michigan provides the second-highest average grant/scholarship aid from Institutional funds of all public peer institutions. U-M’s aid is essential because corresponding State aid is lowest of all public peers.
,Average state grant/scholarship aid,Average state grant/scholarship aid
UC-Berkeley,12470,
UCLA,11535,
Georgia Tech,10114,
Washington,8815,
Illinois,7583,
Texas-Austin,7410,
UNC-Chapel Hill,5015,
Virginia,4717,
Ohio State,3332,
Wisconsin,2698,
MICHIGAN,,1513
,Average institutional grant/scholarship aid,Average institutional grant/scholarship aid
Virginia,26986,
MICHIGAN,,20048
UC-Berkeley,14826,
Georgia Tech,13139,
Wisconsin,12811,
UNC-Chapel Hill,11706,
UCLA,11285,
Illinois,10783,
Ohio State,9815,
Washington,7669,
Texas-Austin,4449,
SOURCE: Integrated Postsecondary Education Data System (IPEDS)
Only one public peer university – the University of Virginia, at $26,968 per student – offered larger average institutional grant and scholarship aid to first-year undergraduate students during academic year 2023. U-M’s average institutional grant/scholarship aid to first-years was $20,048.
The average State of Michigan grant/scholarship to U-M students is smaller than the comparable average state aid provided to any other AAU public university. In 2024, the State of Michigan recently began awarding the Michigan Achievement Scholarship, and the effect it has on average state aid will begin to show up in future years.
Pell Grants & Family Income Distribution
Overall, the fraction of first-year undergraduate students from families with high incomes has increased for Fall 2023 compared to Fall 2013.
,"$25,000 or Less","$25,001 - $50,000","$50,001 - $100,000","$100,001 - $150,000","Greater than $150,000 or did not apply for aid"
2013 In-State First-Years,6,7,18,19,49
2023 In-State First-Years,6,7,14,14,59
 , , , , ,
2013 Out-of-State First-Years,4,4,9,7,76
2023 Out-of-State First-Years,7,8,9,6,70
 , , , , ,
2013 In-State All Undergraduates,9,8,16,15,51
2023 In-State All Undergraduates,9,7,13,12,59
 , , , , ,
2013 Out-of-State All Undergraduates,5,4,7,5,78
2023 Out-of-State All Undergraduates,5,6,7,4,78
SOURCE: U.S. Department of Education
Family income is based on data reported by families on the Free Application for Federal Student Aid (FAFSA), an online form that college students must complete to be considered for financial aid. This chart does not account for inflation. The median household income of Michigan families was 36% higher in 2023 compared to 2013, which partially accounts for the higher proportion of students from families in higher income categories.
In 2022-23, the U-M enrolled a lower percentage of students who received Pell Grants compared to many other AAU public universities, and slightly higher than the levels at most private AAU universities.
,Percent of Students Receiving Pell Grants,Percent of Students Receiving Pell Grants,Percent of Students Receiving Pell Grants
UC-Riverside,47,,
SUNY-Stony Brook,38,,
UC-Irvine,37,,
UC-San Diego,33,,
Buffalo,32,,
UC-Santa Cruz,32,,
UC-Davis,31,,
South Florida,30,,
Arizona State,30,,
UC-Santa Barbara,28,,
Rutgers,27,,
UCLA,27,,
UC-Berkeley,27,,
Arizona,26,,
Texas-Austin,25,,
Illinois,24,,
Columbia,,23,
Oregon,22,,
Florida,22,,
USC,,22,
Michigan State,20,,
UNC-Chapel Hill,20,,
Utah,20,,
Missouri,20,,
Kansas,20,,
Johns Hopkins,,20,
Ohio State,19,,
Texas A&M,19,,
Princeton,,19,
Yale,,19,
Stanford,,19,
NYU,,19,
MIT,,19,
Northwestern,,19,
Maryland-College Park,19,,
Vanderbilt,,19,
Emory,,18,
Iowa,18,,
MICHIGAN,,,18
Cornell,,18,
Boston,,18,
Minnesota,17,,
Indiana,17,,
Case Western Reserve,,17,
Rice,,16,
Rochester,,16,
Penn,,16,
Washington-St. Louis,,16,
Harvard,,16,
Washington,15,,
Dartmouth,,15,
Miami,,15,
Wisconsin-Madison,15,,
Carnegie Mellon,,15,
George Washington,,15,
Colorado,15,,
Cal Tech,,15,
Brandeis,,14,
Virginia,14,,
Pittsburgh,14,,
Georgia Tech,14,,
Chicago,,14,
Purdue,13,,
Penn State,13,,
Brown,,13,
Duke,,13,
Tufts,,12,
Notre Dame,,12,
Tulane,,9,
SOURCE: Integrated Postsecondary Education Data System (IPEDS)
In the chart above, light blue columns represent AAU public institutions, light gray columns represent AAU private institutions, and the dark blue column represents U-M.
Pell grants are need-based awards made to students based on the family’s Student Aid Index, as calculated on the FAFSA. Starting in the 2024-25 academic year, more students qualified for Pell grants due to new awarding guidelines outlined in the FAFSA Simplification Act.
Many more U-M undergraduate students received Pell grants in 2023-24 compared to a decade prior.
,In-State,Out-of-State
2015,3486,1227
2016,3349,1274
2017,3303,1462
2018,3615,1671
2019,3783,1840
2020,3944,2095
2021,3958,2160
2022,3910,2157
2023,3925,2217
2024,4153,2396
SOURCE: U-M Office of Financial Aid
In academic year 2015, 26% of the undergraduate students receiving Pell grants were from out-of-state. As of academic year 2024, this percentage has risen to 37%.
Weekly Hours of Paid Work by U-M Undergraduate Students
Over half of U-M undergraduate students worked for pay while in school, according to survey data; of those who did, most worked 10 hours a week or less during the academic year.
3.8 Weekly Hours of Paid Work by U-M Undergraduate Students, 2009-2024
,Did not work for pay,Worked 1-10 hours per week,Worked 11-20 hours per week,Worked over 20 hours per week
2009,47,28,19,5
2010,49,29,18,5
2011,47,28,20,6
2013,46,28,20,6
2014,45,27,20,7
2015,45,27,21,7
2017,45,29,20,7
2018,46,29,19,6
2019,45,29,20,7
2022,47,29,18,6
2024,45,31,17,7
SOURCE: University of Michigan Asks You (UMAY) undergraduate survey
According to student survey results, the time devoted to work for pay has been fairly consistent over time. Students commonly work for pay to help cover living expenses, reduce the need for loans, or gain practical experience related to their academic or career interests.
Average U-M Student Loan Debt
Nearly two-thirds of in-state undergraduate students in the 2024 graduating class completed their degrees without incurring student loan debt.
3.9 Average U-M Student Loan Debt at Graduation for All, In-State, and Out-of-State Undergraduate Students, 2023-24
| 2023-24 Graduating Class (8,190) | In-State (4,210) | Out-of-State (3,980) | |
|---|---|---|---|
| Average Loan Burden | $26,801 | $21,882 | $34,287 |
| Number of Graduates with Loans | 2,635 | 1,590 | 1,045 |
| Percent Graduating without Student Loan Debt | 68% of all undergraduates | 62% of in-state graduates | 74% of out-of-state graduates |
SOURCE: U-M Financial Aid Data
Thirty-three percent of the 2023-24 undergraduate class graduated with debt. The average loan burden for in-state student graduates was $21,882 and for out-of-state students was $34,287. Compared to the previous year’s graduating class, the average debt burden at graduation decreased by $342 for in-state students and increased by $867 for out-of-state students. The number and percentage of in-state students with loan debt at graduation increased by 56 (+0.2%) compared to the previous year.
In interpreting loan burden figures, it is important to distinguish between subsidized and unsubsidized loans. Students who apply for financial aid at U-M are automatically offered low-interest subsidized federal loans, which are included as part of financial aid packages and don’t accrue interest until 6-months after a student graduates. Unsubsidized loans, which are also offered by the federal government and available to all students, accrue interest while students attend university. Private loans and PLUS loans require a separate application and typically have higher interest rates.
Previous Chapter
Undergraduate Students: Admissions & Enrollment
Committed to Access & Excellence
Next Chapter
Undergraduate Student Success
Preparing Leaders for the 21st Century