

Chapter 11
Space & Sustainability
Goals
Campus space must support the academic and research missions of the university. This means crafting and applying comprehensive policies on the allocation and use of existing and incremental space, while directing the capital planning necessary to meet the institution’s future needs.
Energy, climate action, sustainability and environmental equity are an important pillar of the university’s Look to Michigan strategic vision. As such, the university has set goals for greenhouse gas emissions, carbon output of university vehicles, and production of waste, with the future goal of carbon neutrality.
Overview
The physical plant of the University of Michigan Ann Arbor campus is extensive, covering 3,279 acres locally. The campus includes 559 buildings with 2,783 classrooms and instructional laboratories, 1,589 study rooms, and 8,100 research labs/rooms. The U-M is responsible for 29 miles of roads and 7.4 million square feet of sidewalks, steps, ramps, and plazas. More than 16,500 trees and countless gardens populate the campus, as well as 24.3 million square feet of turf. Fiber optic cable extends more than 200 miles throughout the campus, supporting data centers, file servers, computers, and tablets.
Space utilization guidelines exist for classrooms, food service, research activities, and offices. Space management contributes to efficiency and cost containment while also ensuring that there is enough space available for effective teaching.
In early 2021, the President’s Commission on Carbon Neutrality released recommendations for reducing the U-M’s carbon emissions to levels that will help the institution reach 2025 and 2040 sustainability goals. Recommendations included converting natural gas-based heating and cooling systems to all-electric or geothermal systems. In February 2023, the Ann Arbor campus announced that it had reached two of the 2021 goals: compared to 2006 benchmarks, greenhouse gas emissions have dropped by 25%, and the application of chemicals to campus grounds has declined by 40%.
Campus Plan 2050 was released in September 2024 to guide the next 25 years of change to the Ann Arbor campus. The initiative proposes innovative infrastructure solutions, including geo-exchange systems designed for efficient heating and cooling through ground-source heat pumps, as well as extensive building retrofits that enhance energy efficiency and sustainability, and efficiency upgrades to the transit system. A three-year solar panel installation project started in 2024, with a goal of a total capacity of 25 megawatts of renewable electricity after a three-year installation process is complete.
Total Space by General Fund and All Other Funds
About half of Ann Arbor campus space is supported by the General Fund and is used for teaching, non-sponsored research, student services, support of the campus physical plant, and administration.
,General Fund,All Other Funds
2016,8.39,10.28
2017,8.44,10.29
2018,8.62,10.45
2019,8.71,10.39
2020,8.91,10.63
2021,9.06,10.54
2022,9.08,10.56
2023,9.03,10.5
2024,8.95,10.59
2025,8.95,10.63
SOURCE: U-M Annual Space Management Survey Reports
Ann Arbor campus space supported by the General Fund is used for teaching, research, student services, support of the campus physical plant, and administration. The remaining spaces are largely self-supporting through charges for services; hospitals and health system, residence halls, parking structures and varsity athletic facilities. These space categories are labeled “net assignable,” which means they exclude common areas, such as hallways, staircases, and lobbies.
In this chart, the North Campus Research Complex is included in the All Other Funds category. The non-Medical School portion of the Health System is excluded.
Space by Function
Ann Arbor campus space has increased by 1.36 million net assignable square feet over the last decade at an annual growth rate of about 1.0 percent. All types of space are needed to support the university’s mission.
,Teaching & Research,Library,Administration,"Parking, Athletics, Other",Plant & Operations,Student Housing,Unclassified
2015,4.9,0.8,2.3,6.0,0.8,3.5,1.3
2016,5.0,0.8,2.4,6.3,0.8,3.7,0.9
2017,5.1,0.8,2.4,6.2,0.8,3.7,0.7
2018,5.1,0.8,2.3,6.4,0.7,3.7,0.9
2019,5.2,0.9,2.3,6.4,0.7,3.6,0.9
2020,5.1,0.9,2.4,6.3,0.7,3.7,1.4
2021,5.2,0.9,2.3,6.7,0.7,3.7,1.1
2022,5.3,0.9,2.3,6.8,0.7,3.6,1.0
2023,5.4,0.8,2.4,6.7,0.7,3.6,0.7
2024,5.4,0.8,2.4,7.0,0.7,3.6,0.7
SOURCE: U-M Office of Space Analysis
Space in the unclassified category is either not in use or being remodeled. Plant and Operations includes space used in the operation and maintenance of the university’s physical plant, its heating/cooling and other utilities services, central information technology services, and some special service operations, such as printing services.
About 5/6 of the space in the Parking, Athletics, Other category is used by parking and athletics. The remainder supports activities such as development, government and community relations, student clubs and organizations, as well as university space leased to private entities or operated under a management agreement with an outside entity (i.e. food service in the student unions). The need for parking and the growth in athletic facilities have driven this category to grow the most over the decade displayed.
Administration combines space used by central functions, departmental functions, and student administration and student services.
Net assignable space excludes hallways, restrooms, elevators, and custodial areas. It also excludes the space assigned to the non-Medical School portion of the Health System.
Age of Buildings
More than half of the buildings used for core activities have been built or remodeled in the last 50 years. Almost one-fifth of the buildings on campus are at least 90 years old.
,Gross Sq Ft (Millions)
<10,1.07
10-20,2.24
20-30,1.65
30-40,1.61
40-50,1.14
50-60,2.16
60-70,1.49
70-80,0.97
80-90,0.56
90-100,0.97
>100,2.05
SOURCE: U-M Space Dataset
The last 20 years saw a large increase in new construction on campus tied to several U-M initiatives. During this period, the U-M campus added the Biomedical Sciences Research Building, Undergraduate Science Building, Palmer Commons, Computer Science Building, and the Ross School of Business building.
Core activities include teaching, research, student services, support of the campus physical plant, and administration, Buildings associated with auxiliary activities (e.g., U-M hospitals and clinics, student residence halls and athletic facilities) are not included in this chart because these facilities are not supported by the General Fund.
Buildings on campus that are more than 100 years old include the President’s House, Newberry Hall, Tappan Hall, Burnham House, and two barns at Matthaei Botanical Gardens; the 100-year-old structures contribute about 850,000 gross square feet to the campus total.
Renovation & Construction
The university tries to maintain a balance between adding new space and renovating existing space on campus.
,Renovations,New Construction,Total Depreciation
2015,500,269,281
2016,420,251,334
2017,357,314,319
2018,425,272,352
2019,387,217,343
2020,449,159,346
2021,335,99,355
2022,230,101,341
2023,294,235,381
2024,446,352,380
SOURCE: U-M Office of Financial Analysis
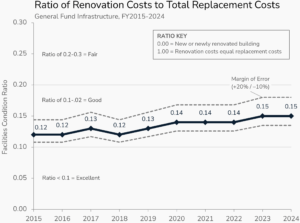
Ratio of Renovation Costs to Replacement Costs
The overall condition of General Fund buildings on the Ann Arbor campus has remained consistent. The U-M continues to monitor building conditions by identifying and prioritizing infrastructure needs.
11.5 Ratio of General Fund Infrastructure Renovation Costs to Total Replacement Costs, FY2015-FY2024
SOURCE: U-M Office of Financial Analysis
The facilities condition ratio is an indicator of building condition that divides the cost of needed building renovations by the cost to replace those structures. The ratio maximum of 1.0 indicates that the cost of renovating the existing facilities equals their total replacement. A ratio of 0 would mean no renovations are necessary; that is, the facilities are all new or newly renovated. A ratio of 0.2-0.3 is generally considered Fair, 0.1-0.2 is considered Good, and below 0.1 is considered Excellent.
Sustainability
Total energy use in campus buildings and energy use per square foot per person has declined compared to a decade ago because new construction and remodeled space is more efficient.
,Total Building Energy (Trillion BTUs),Building Energy per Square Foot per Person (BTUs)
2016,6.94,2.11
2017,7.12,2.1
2018,7.02,1.97
2019,6.96,1.89
2020,6.75,1.78
2021,6.73,1.78
2022,6.93,1.76
2023,6.95,1.74
2024,6.71,1.63
2025,6.81,1.64
SOURCE: U-M Utilities and Plant Engineering
In 2015, the university invested $100 million toward efforts to accelerate progress in the areas of waste reduction, greenhouse gas reduction and campus sustainability culture. This led to significant work towards reducing waste and increasing energy efficiency, including the expansion of the university’s energy management program to more campus buildings.
Net greenhouse gas emissions from campus buildings and vehicles have declined over the past several years as the fuel source for generating electricity has shifted to natural gas over coal.
,U-M Generated Energy Emissions,Purchased Energy Emissions
2016,281,353
2017,287,348
2018,285,338
2019,278,361
2020,273,319
2021,276,246
2022,284,193
2023,300,177
2024,286,155
2025,294,157
SOURCE: U-M Utilities and Plant Engineering
The level of greenhouse gas emissions is influenced by two factors: total energy usage and the energy provider. University-generated energy is optimized for efficient production and to limit greenhouse gas production. The university also purchases some energy generated at coal-fired plants, which produces higher levels of greenhouse gases. As natural gas becomes competitive with coal as a fuel source, U-M’s external energy providers are shifting to this fuel, and greenhouse gas emissions have fallen. Also, U-M is making strides in producing energy from renewable sources.
Total waste generated on-campus is comparable to a decade prior, despite a 25% increase in campus population. Recycled waste as a percentage of total waste has increased over time.
,Disposed Waste,Recycled Waste
2016,14079,5698
2017,12780,6531
2018,12396,7526
2019,12801,7380
2020,10973,5678
2021,8891,6539
2022,11451,7067
2023,11871,6980
2024,11284,6609
2025,11452,6441
SOURCE: U-M Waste Management
The values in the red columns indicate the percentage of total waste that was recycled. Total waste tends to track the overall space in use, which is increasing, so there is constant tension between space growth and waste that is recycled.
In fall of 2020, the U-M Office of Campus Sustainability introduced “Where to Throw,” a web application that allows the user to enter an item’s description and find out the best method of reuse, recycle, composting, or, if necessary, disposal. See ocs.umich.edu/resources/where-to-throw/.
In 2024, the university purchased less than half as much paper as it did a decade earlier.
,No Recycled Content,30 Percent Post-Consumer Recycled,50 Percent Post-Consumer Recycled,100 Percent Post-Consumer Recycled
2016,338306,185278,13306,7112
2017,260550,57972,2057,56527
2018,308680,100681,8028,4410
2019,296419,92269,4270,4200
2020,234942,62145,1800,3495
2021,95999,8009,1831,589
2022,163258,20538,3895,678
2023,181717,2232,1834,102
2024,157142,21164,232,760
2025,153378,20473,349,984
SOURCE: U-M Office of Campus Sustainability
In FY2020 and FY2021, total paper use declined significantly, which was not only an effect of the campus closing down due to the COVID-19 pandemic, but also part of an overall trend to reduce paper consumption. In FY2022, paper use increased as regular on-campus activity resumed, but didn’t return to pre-pandemic levels. Total paper purchased has continued to decrease through FY2025.
Previous Chapter
Budgets & Fundraising
Supporting Our Commitment to Excellence & Affordability
Next Chapter
Academic & Reputational Rankings
A Leading Public University